How Much Do Facebook Ads Cost a Small Business?
Most small businesses can buy their first useful Meta test for $600 to $2,800, spread over three to four weeks. Below roughly $20 a day per ad set you can still learn whether your creative earns attention, but you cannot learn what a customer costs. That is the short answer. The rest of this page is why, and how to tell which band you are actually in.
Facebook and Instagram ads are priced differently from search. Google Ads cost moves with keyword competition, so the classic lever is pruning expensive queries. Meta has no keywords. You buy impressions, and your real cost is decided by CPM, click-through rate, conversion rate, and how fast your creative burns out. If you came here from our Google Ads cost guide, treat this as the sibling page, not a copy of it.
Why every published Facebook ads benchmark disagrees
Search “average Facebook ads CPC” and you will get three confident numbers from three sources. They disagree because they measure different objectives, different industries, and different years. Here are three real, checkable published figures side by side.
| Source | Data period | What it reports |
|---|---|---|
| WordStream Facebook advertising benchmarks | November 2016 – January 2017, from 256 US accounts (stated on the page) | CPC $1.72, CTR 0.90%, conversion rate 9.21%, CPA $18.68, all industries |
| LOCALiQ Facebook ads benchmarks | Last updated 24 October 2025 | Traffic campaigns: CPC $0.70, CTR 1.71%. Leads campaigns: CPC $1.92, CTR 2.59%, CVR 7.72%, cost per lead $27.66 |
| Meta Q4 and full-year 2025 results | Calendar 2025 | Average price per ad up 9% for the full year, up 6% in Q4, both year over year; ad impressions up 12% for the year |
Two things fall out of that table. First, the most-quoted Facebook CPC on the internet is built on data from the winter of 2016 and 2017, and the page states that window itself. Anyone citing $1.72 as a current number in 2026 has not read their own source. Second, even inside one current dataset the spread is enormous: LOCALiQ’s own leads table runs from $3.16 cost per lead in Restaurants & Food to $76.71 in Dentists & Dental Services, with CPC from $0.74 to $9.78. That is a 24x range on the same chart, in the same year.
So do not budget against an average. Budget against your own arithmetic, which we will build below. A benchmark is only useful as a sanity check after you have your own numbers.
CPM is the meter, not CPC
Meta bills you for impressions. CPC and cost per lead are outputs, not inputs. The chain is:
- CPM divided by 1,000 gives you cost per impression.
- Divide that by your CTR to get effective CPC.
- Divide that by your landing page conversion rate to get cost per acquisition.
Work an example. At a $15 CPM and a 1.5% CTR, your CPC is $1.00. At an 8% conversion rate, your CPA is $12.50. Now hold CPM completely flat and let CTR slide to 0.75%, which is what creative fatigue looks like. CPC doubles to $2.00 and CPA doubles to $25.00. Nothing about the auction changed. Your ad got boring.
| CPM | CTR | Effective CPC | CPA at 8% CVR |
|---|---|---|---|
| $10 | 2.0% | $0.50 | $6.25 |
| $15 | 1.5% | $1.00 | $12.50 |
| $15 | 0.75% | $2.00 | $25.00 |
| $30 | 0.75% | $4.00 | $50.00 |
Arithmetic, not measured results. These are the relationships between the four numbers, and you can reproduce them in our CPC, CPM and CTR calculator and CPA calculator with your own figures.
This is the practical difference between the two platforms. On search you lower cost by cutting bad queries. On Meta you lower cost by making better creative, because CTR works on you twice: it sets your effective CPC directly, and Meta’s auction also factors estimated action rates into which ad wins the impression. Two advertisers targeting the identical audience can see very different CPMs on the same day.
Creative fatigue is your real cost curve
Small businesses hit fatigue faster than big ones, and the reason is arithmetic. A national brand targets tens of millions of people. A plumber targeting one metro might have an addressable audience of 60,000. Spend $50 a day at a $15 CPM and you are buying about 3,333 impressions a day, 100,000 a month. Against a small audience that is repeated exposure very quickly. Frequency climbs, CTR falls, effective CPC rises, and it looks like Meta got more expensive. It did not. You ran out of new people to show the same ad to.
Watch for this pattern in Ads Manager. These are practitioner rules of thumb, not thresholds Meta publishes:
- Frequency climbing past roughly 2 to 3 in a rolling 7-day window.
- CTR falling while CPM stays flat.
- CPM rising while CTR falls, which is the worse version, because the auction is now pricing you less favourably.
- Cost per result climbing steadily with no change to targeting or budget.
The fix is new creative, not a bid change. Budget for it: plan on three to five distinct concepts for a first test, not three tweaks of one image. If writing that volume is the bottleneck, that is precisely the job our AI ad management layer exists to do.
The learning phase, and the number that decides your budget
This is the single most important cost mechanic on Meta and it is barely mentioned in most cost articles. When you launch or significantly edit an ad set, it enters the learning phase while Meta’s delivery system works out who to show it to. Performance is unstable and usually worse during this period. Meta’s own Business Help Center article, About the learning phase, is the source of the number everyone quotes: an ad set generally needs around 50 optimization events in roughly a week to exit learning.
Fifty events per ad set per week. Now put your own cost per event next to it and the required budget writes itself.
| Your cost per optimization event | Weekly spend for 50 events | Daily budget, one ad set |
|---|---|---|
| $5 | $250 | $36 |
| $10 | $500 | $71 |
| $27.66 (LOCALiQ 2025 all-industry cost per lead) | $1,383 | $198 |
| $50 | $2,500 | $357 |
| $76.71 (LOCALiQ 2025 dental cost per lead) | $3,836 | $548 |
Weekly column is cost per event times 50; daily column is that divided by seven. Arithmetic on top of LOCALiQ’s published figures, not results we measured.
Read that honestly and an uncomfortable conclusion appears. A dental practice optimizing for form-fill leads at LOCALiQ’s published dental cost per lead would need roughly $550 a day in a single ad set to keep that ad set out of learning. Almost no small business is doing that. Most are running $20 a day across three ad sets.
Why a small daily budget can stall forever
The 50-event guidance is measured over a rolling window of about a week, not cumulatively over your campaign’s life. That distinction is everything. At $20 a day and a $28 cost per lead you generate roughly five leads a week. You never reach 50 in any seven-day window, so the ad set never exits learning. It sits in the state Ads Manager labels Learning limited, and it can sit there indefinitely. You are paying full price for the least efficient phase of delivery.
Four things make this worse, and all four are common beginner habits:
- Splitting budget across ad sets. Each ad set needs its own 50 events. Five ad sets means 250 events a week, not 50. Consolidate. One ad set with your whole budget beats five starved ones.
- Editing daily. Meta documents that significant edits restart learning: budget and bid changes, targeting changes, creative changes, changing the optimization event, changing the bid strategy. Meta does not publish a percentage for what counts as significant on budget; the working convention among practitioners is to treat anything above roughly 20% as significant. Tinkering every morning restarts the clock every morning.
- Optimizing for a rare event. If you optimize for purchases and you get four purchases a month, delivery has almost nothing to learn from. Optimize one step up the funnel, for example leads or add-to-cart, until volume supports the deeper event, then move down.
- Pausing overnight or on weekends. The window you are trying to fill with 50 events is only seven days long. Switching delivery off for part of it makes the target harder, not easier.
If your budget cannot support 50 events a week at your real cost per event, you have two honest options: pick a cheaper optimization event, or accept that you are running a creative and audience read rather than a scaled campaign, and judge it as such. Our Meta budget pacing tool is the fastest way to see what your daily number actually buys, and our small business page walks the same maths with a fixed monthly budget.
Q4 is the most expensive time to run your first test
Meta does not publish a public seasonal CPM index, so be sceptical of anyone quoting a precise “Q4 CPMs rise by X%” figure without a source. What Meta does publish is quarterly revenue, and the shape is unambiguous. In its Q4 and full-year 2025 results, Meta reported $59.893bn of revenue in Q4 against $200.966bn for the full year. Q4 alone was 29.8% of the year, where an even year would be 25%. That is roughly 19% above an average quarter.
That is revenue, not price, and Meta reported ad impressions up 18% year over year in Q4, so volume is doing part of the work. But the demand behind it is ecommerce and retail bidding for the same feed slots you want, from late October through Christmas, and the auction clears higher when more money chases the same inventory. If you have any choice about timing, run your first test in January to March or in Q2. If you must test in Q4, budget more per result, expect the number to fall in January, and do not conclude the channel does not work for you based on Black Friday week.
What iOS signal loss changed, and what it did not
Apple shipped App Tracking Transparency in iOS 14.5 in April 2021, requiring apps to ask permission before tracking users across other companies’ apps and sites. Opt-in was low enough that Meta put a number on the damage: on its Q4 2021 earnings call in February 2022, then-CFO David Wehner told investors the change would cost Meta roughly $10 billion of revenue in 2022. That is the scale of the measurement hole you are working inside.
Three practical consequences for a small advertiser:
- Reported results undercount. Conversions Meta cannot see are conversions it cannot report. Your true cost per acquisition is often better than Ads Manager says, which is the opposite of the mistake people expect.
- Attribution windows shortened. The default moved to a 7-day click window. Longer consideration cycles get systematically under-credited.
- Event limits. Aggregated Event Measurement caps you at eight conversion events per verified domain, ranked in priority order. Pick and rank them deliberately.
The counter-move is first-party signal: install the Conversions API alongside the pixel, verify your domain, and reconcile Ads Manager against your own source of truth. Tag your links properly with a UTM builder so your analytics and CRM can tell you what Meta cannot. Judge the channel on blended cost per acquisition across the whole business, not on the in-platform number alone.
Where these numbers live in Ads Manager
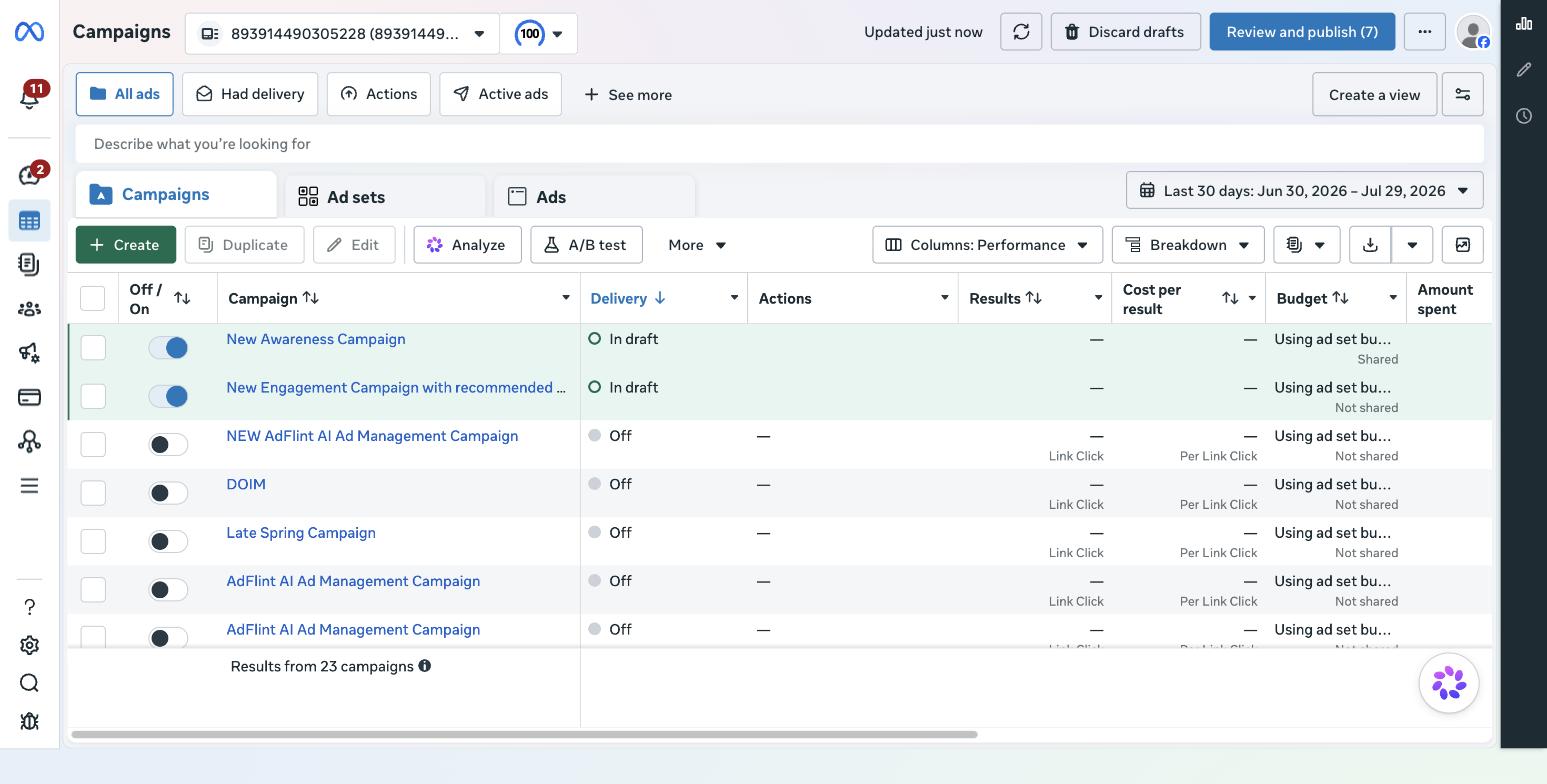
AdFlint’s own Meta Ads Manager campaigns view, captured July 2026. Stated limit: we have not run sustained live ad spend of our own, so treat this as a map of where the controls sit, not as performance data.
Add CPM, frequency, CTR and cost per result as columns at ad set level and leave them there, and keep the delivery status column visible so you can see Learning and Learning limited when they appear. Campaign-level averages hide exactly the ad set that is stuck in learning and eating your budget. If you have only ever boosted posts, the columns will be unfamiliar, and the gap between the two surfaces is real: see boosted posts versus Meta Ads Manager and the Meta Business Manager glossary entry for the structure.
First-test budget bands, and what each one can actually tell you
| Band | What it can tell you | What it cannot |
|---|---|---|
| $10–$20/day, 2 weeks $140–$280 | Whether your creative earns attention. CTR, hook rate, cost per click, whether your audience is reachable at a sane CPM. | Anything about cost per customer. You will not exit learning. Do not optimize for purchases at this level. |
| $30–$50/day, 3 weeks $630–$1,050 | A directional cost per lead if your lead is cheap, roughly $10 or under. Which of three or four creatives wins. Whether the landing page converts. | Scaled economics, or anything about expensive conversions. One ad set only at this level. |
| $70–$100/day, 4 weeks $1,960–$2,800 | A real cost per lead at up to roughly $10 per event with the ad set out of learning. Enough volume for a genuine creative test. | Purchase-optimized economics for a considered, high-ticket purchase. Long sales cycles still need offline reconciliation. |
| $150–$300/day, 4–6 weeks $4,200–$12,600 | Stable delivery at a $20 to $50 cost per event. Multiple ad sets, retargeting, and a defensible answer on whether Meta pays for itself. | Nothing you should skip the cheaper bands to reach. Earn your way up this ladder. |
Bands are the 50-events arithmetic above applied to typical cost-per-event ranges, not measured outcomes from campaigns we ran.
Pick the band that matches the question you are actually asking. Use the ad budget calculator to split a fixed monthly number across channels, and see how AdFlint approaches small business budgets before you commit the first dollar.
A first Meta test, step by step
- 1. Fix your maximum acceptable cost per customer first. Gross margin per sale times an acceptable payback. If you do not know this number, stop; nothing downstream can be judged.
- 2. Choose the optimization event you can actually feed. Divide your planned weekly budget by your best guess at cost per event. If the answer is under 50, move one step up the funnel.
- 3. Install the pixel and the Conversions API. Both, not one. Verify your domain.
- 4. Rank your eight Aggregated Event Measurement events. Highest-value event first.
- 5. Build one campaign and one ad set. Resist splitting. Consolidated budget is how you reach 50 events.
- 6. Keep targeting broad. Narrow interest stacks raise CPM and shrink the pool, which accelerates fatigue. Broad plus strong creative is the prevailing advice in 2026; we are repeating the consensus here, not reporting our own test.
- 7. Load three to five genuinely different creative concepts. Different angles, not different crops. Include at least one 9:16 vertical and one 4:5.
- 8. Set a hard budget cap before you launch, not after. A cap you set while calm is worth more than one you set while panicking.
- 9. Do not touch it for seven days. Every significant edit restarts learning. This is the hardest step and the one people skip.
- 10. Read ad set level, not campaign level. Columns: cost per result, CPM, CTR, frequency, delivery status.
- 11. At day 7, cut only the clearly dead creative. Judge creative on CTR and cost per result, and do not call a winner on 40 clicks. Run it through an A/B significance calculator before you believe it.
- 12. At day 14, decide on economics, not on feel. Compare actual cost per result to the number from step 1.
- 13. Scale in small steps. Same convention as step 9 in reverse: keep budget increases modest, commonly 20% or less at a time, because large jumps can re-enter learning and undo the stability you paid for.
- 14. Refresh creative before performance drops, not after. Fatigue is a queue problem. Keep the next concept ready.
- 15. Reconcile against your own books monthly. Blended cost per acquisition across the business is the number that matters, because iOS signal loss means Ads Manager is showing you a partial view.
Running Google and Meta together
Most small businesses should not choose. Search captures people already looking; Meta creates demand from people who were not. They also fail differently, which is useful: search costs spike when competitors bid, Meta costs spike when your creative goes stale. If you are budgeting both, running Google and Meta side by side makes the comparison honest, and Facebook ads for small business covers the Meta-specific setup in more depth.
Where AdFlint fits, and what we have not proved
AdFlint writes, launches and optimizes Meta ads and Google Ads from one place. The parts that matter for the cost question: you connect and own your own ad account over OAuth, budget caps are hard caps, we charge 0% markup on ad spend, there is a 7-day free trial, the plan ladder tops out at $30,000 a month of managed spend, and autopilot keeps optimizing after launch instead of leaving an ad set stuck in learning while nobody is looking. Pricing is on the pricing page and the sequence is on how it works. If you would rather compare tools first, our Facebook ads management tools roundup collects hands-on notes from trial accounts we created ourselves in July 2026 — with the limit stated there too, that we never connected a live ad account to those tools, so we have not seen their optimization quality.
The limit here, stated plainly: we have not run sustained live ad spend of our own, so every cost figure on this page is either arithmetic or attributed to a named source you can click. We have no case studies and no ROAS numbers to show you. If you want the practical version of all of the above applied to a real budget, start with AdFlint for small business and bring your own maximum cost per customer with you. That one number decides everything else.
Related guides
How Much Do Google Ads Cost for a Small Business?
Budget $500 to $2,000 for a first test, then judge it on CPC, conversion rate, and cost per conversion. How to size a test that teaches you something real.
Google or Meta Ads First? Decide by Budget
Google first under about $5,000 a month; above it, run both but sequence them. The Meta learning-phase math behind the rule and five checks that override it.
Conversion Tracking Setup for Google and Meta
Google tag, GA4 key events that import as secondary, enhanced conversions, Pixel plus Conversions API with event_id dedupe, and consent mode v2, in order.
Skip the learning curve
AdFlint writes, launches, and optimizes Google and Meta campaigns inside the ad account you own — you approve every ad, and hard budget caps protect your spend. 7-day free trial.
Free tools: ad copy generator, ROAS calculator, budget calculator · ads by industry